
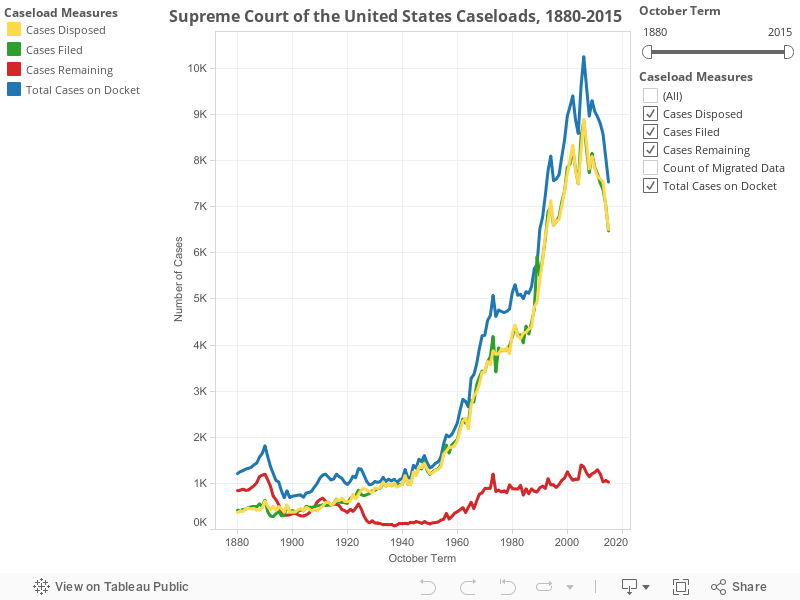
Supreme Court Caseloads, 1880-2015
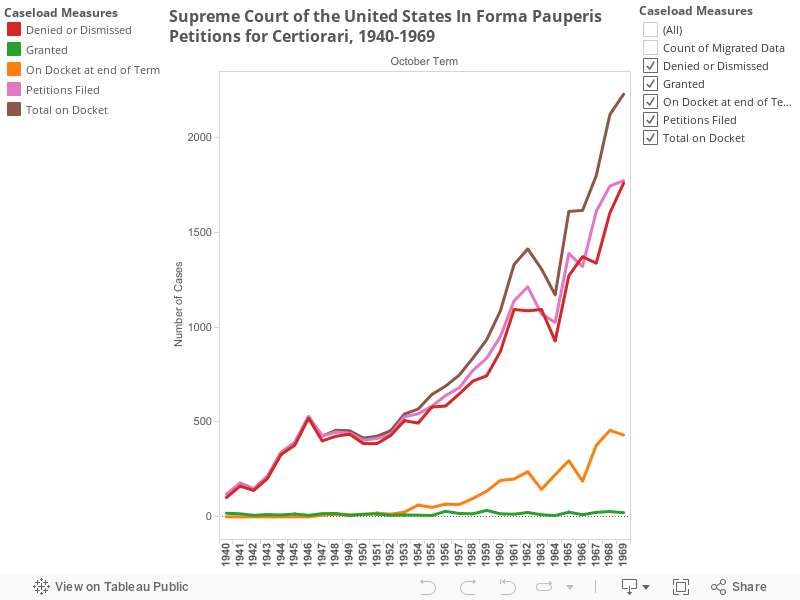
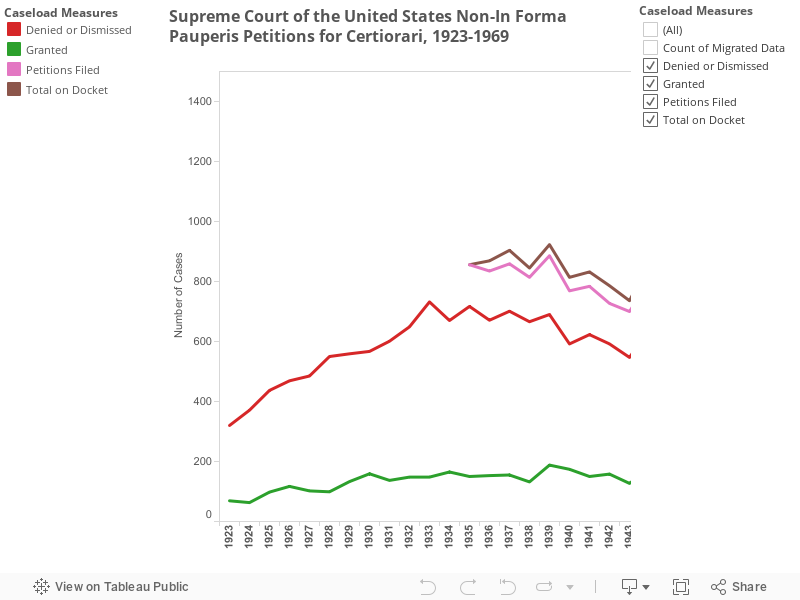
The Supreme Court of the United States has maintained and published its own caseload data since 1880. Much of the data is compiled in the Court’s annual Journal.[1] While the number of cases on the Court’s docket has generally increased over time, Congressional legislation has occasionally produced changes in the number of cases filed with the Court or the number of appeals the justices hear. Thus, for example, the creation of intermediate courts of appeal appears to have produced a substantial drop in the total number of cases on the Court’s docket in the 1890s. Likewise, the Judges’ Bill of 1925, which made many appeals discretionary through the use of writs of certiorari, appears to have allowed the Court to reduce the number of cases remaining on the docket at the end of several of the subsequent years. Moreover, institutional changes, such as the increased number of clerks assigned to each justice and the use of clerk “pooling” for the review of some petitions, have kept that number from increasing at the same rate as the number of cases filed with the Court each year. The graph below shows the total number of cases filed, disposed of, and remaining on the Court’s docket over time.
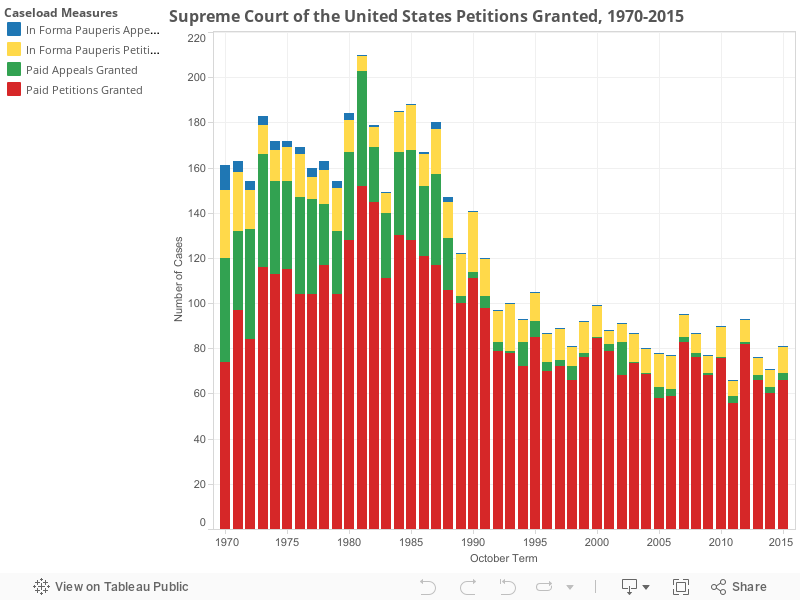
The next set of charts reflect the Court’s selection of cases for review. The Supreme Court divides its data between in forma pauperis petitions, many of which are filed by indigent criminal defendants, and paid petitions, which reflect the bulk of other appeals. The graphs show a relatively steady number of petitions granted in each category over time despite the increasing number of cases filed with the Court up to 1969, when the Court changed its reporting methodology. As a rule, the Court generally granted significantly more paid petitions than in forma pauperis petitions, which are frequently prepared without the aid of a lawyer and thus are less likely to comport with legal procedures or to present questions appropriate for Supreme Court review. You can use the controls to the right of the chart to focus on a single caseload measure, such as the number of petitions granted or filed.
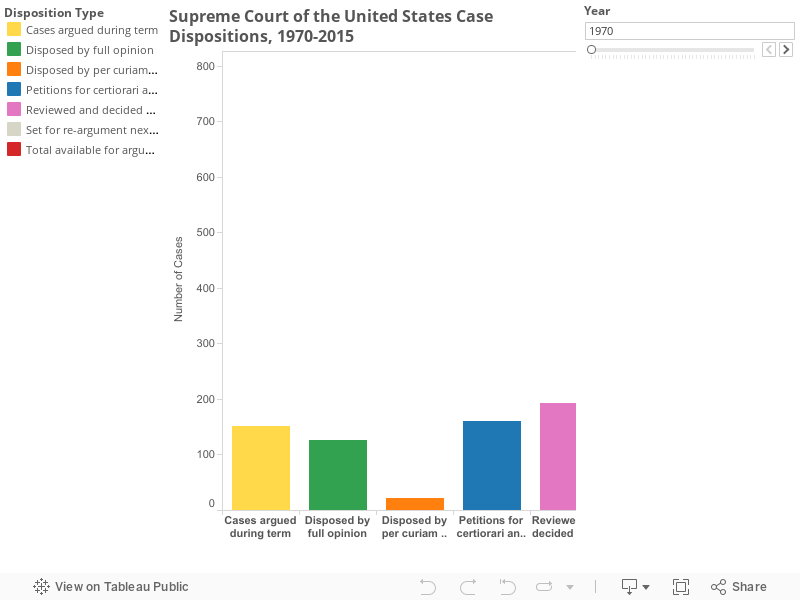
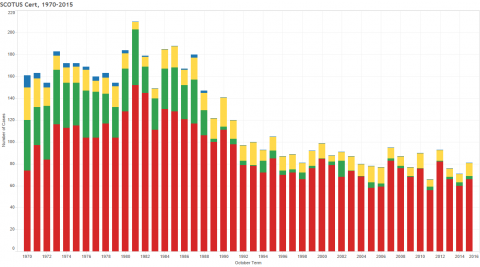
The next chart reflects the distribution of cases heard by the Court from 1970-2015, with a further division between petitions for writs of certiorari and writs of appeal. The latter category of case, which the Court must hear barring other procedural impediments, once made up a large proportion of its caseload. However, Congress substantially curtailed the use of this form of appeal several times during the course of the twentieth century. Since 1988, the only cases involving this form of mandatory appeal are electoral redistricting suits. Such appeals are unlikely to be brought by indigent parties, such that the chart reflects no accepted in forma pauperis writs of appeal after 1988.
[1] The Court’s Journal is available online at https://www.supremecourt.gov/orders/journal.aspx. Wherever possible, graphs on this page use the nomenclature applied to caseload measures by the Journal, including the descriptors for writs of appeals and writs of certiorari. Supreme Court caseload figures for the 1880s through the 1970s employing slightly different caseload categories and statistical measures are also available. See, e.g., Gerhard Casper and Richard A. Posner, The Workload of the Supreme Court (Chicago: American Bar Foundation, 1976).